1. Participation in Sport and Recreation by People with Disabilities
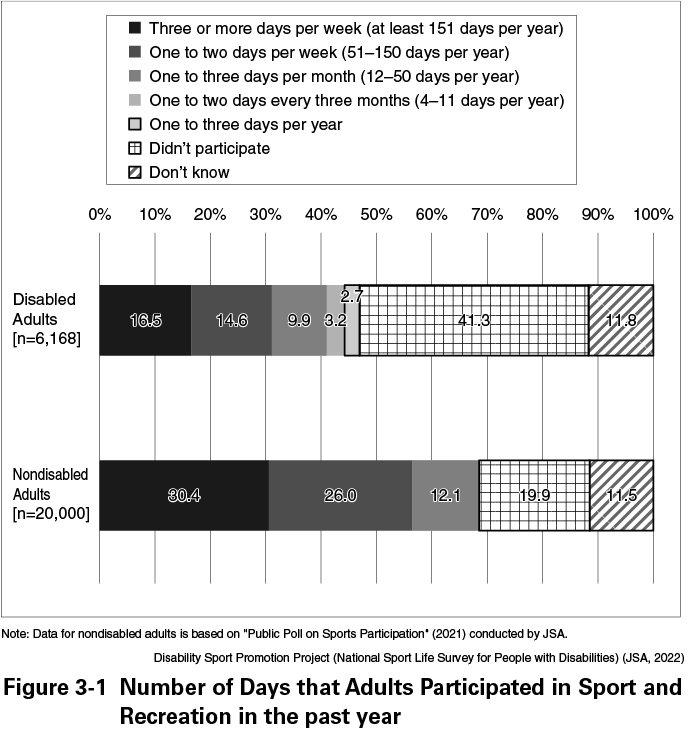
Figure 3-1 displays the number of days people participated in sport and recreation in the past year, with the results for adults with disabilities on top and those for adults without disabilities at the bottom, respectively. The upper results are based on the report titled “Disability Sport Promotion Project (National Sport Life Survey for People with Disabilities)” (2022) while the lower results are based on “Public Poll on Sports Participation” (2021), both conducted by the Japan Sports Agency (JSA).
The data indicates that 16.5% of adults with disabilities participated three or more days per week compared to 30.4% of nondisabled adults, while 14.6% of adults with disabilities participated one to two days per week compared to 26.0% of nondisabled adults. Using these two levels of participation as a standard for representing individuals who regularly engaged in sport and physical activities at least once a week, the total level of participation for adults with disabilities came to 31.1%, which is limited to about half of that for nondisabled adults of 56.4%. Even more striking is the fact that the percentage of individuals who did not participate in sport and physical activities was at least two times higher for adults with disabilities (41.3%) than nondisabled adults (19.9%). Regarding the results by types of disability for adults who participated in sport and physical activities at least one day a week, the percentage was approximately 30% for most types of disability (limb impairment (not requiring wheelchair), visual impairment, hearing impairment, intellectual disability, developmental disability, mental disorder and voice/language/ masticatory dysfunction), while it was about 25% for limb impairment (requiring wheelchair).
Participation in Sport and Recreation by People with Disabilities by Types of Sport
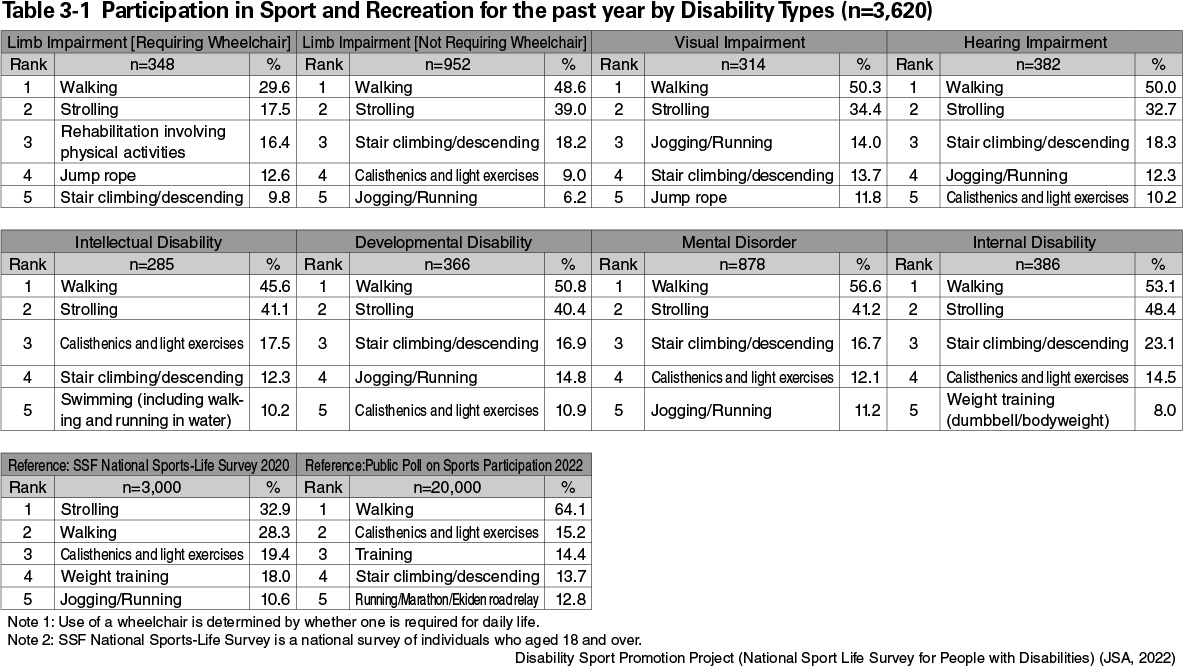
Table 3-1 displays the types of sport and recreational activities performed by adults with disabilities in the past year, sorted by eight types of disability. “Walking” had the highest participation rate for all disability types, followed by “Strolling”. “Calisthenics and light exercises”, “Stair climbing/descending” and “Jogging/Running” were the top choices. In the category of “Limb impairment (requiring wheelchair)”, it should be pointed out that “Rehabilitation involving physical activities”, which is conducted as part of rehabilitation, ranked third.
Purposes of Participating in Sport and Physical Activities for People with Disabilities
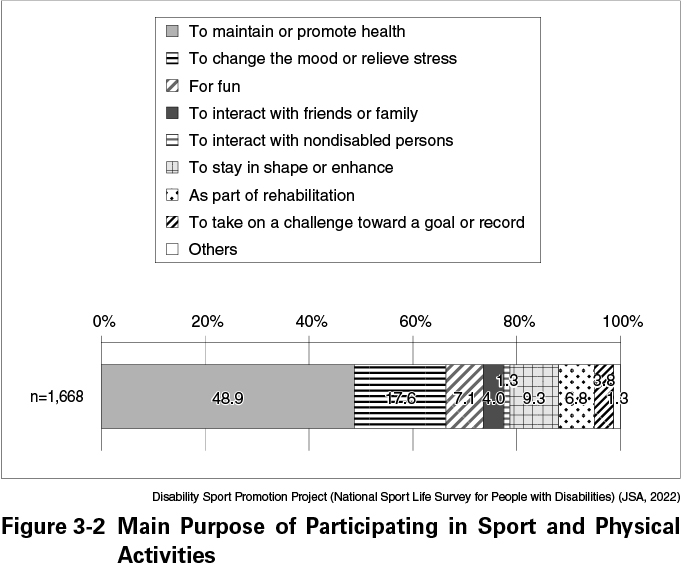
Figure 3-2 shows the purposes of participating in sport and physical activities for people with disabilities based on one main purpose that respondents chose among the nine options. The two purposes of participating, “To maintain or promote health” (48.9%) and “To change the mood or relieve stress” (17.6%) together accounted for about 70%, followed by “For fun” (7.1%) and “To interact with friends or family” (4.0%). The JSA’s survey “Public Poll on Sports Participation” showed a similar trend, with many respondents answering that participation in sport and physical activities was for their health, for the promotion and maintenance of physical fitness, for eliminating a lack of exercise, or for pleasure and fun.
Interest in and Satisfaction with Sport and Physical Activities for People with Disabilities
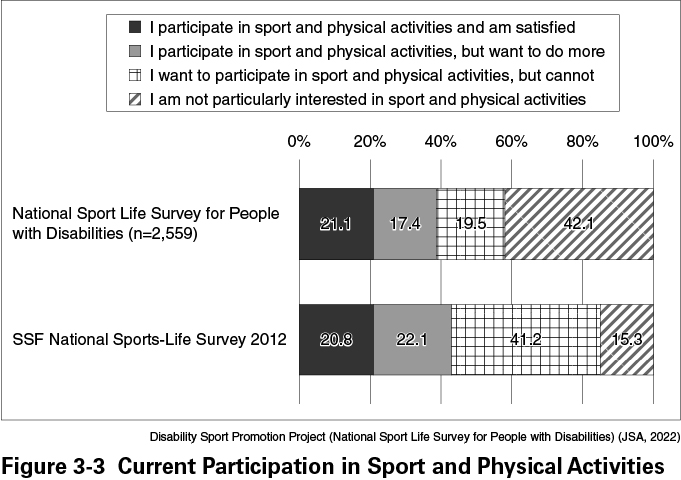
Figure 3-3 displays the current level of interest in and satisfaction with sport and physical activities among people with disabilities. “I am not particularly interested in sport and physical activities” received the highest number of response (42.1%), followed by “I participate in sport and physical activities and am satisfied” (21.1%) and “I want to participate in sport and physical activities, but cannot” (19.5%). Compared with results of the SSF National Sports-Life Survey (2012) of adults without disabilities, the percentage of individuals who reported “I am not particularly interested in sport and physical activities” was high among those with disabilities. In terms of whether or not individuals participated in sport and physical activities in the past year, 73.7% of those who did not participate responded that they were “not particularly interested in sport and physical activities”, which was about three times the percentage among those who participated.
Participation in Sport and Physical Activities by Children and Young People with Disabilities
According to the “Disability Sport Promotion Project (National Sport Life Survey for Children and Adults with Disabilities)” (2022) conducted by the JSA, among children and young people with disabilities aged between 7 and 19 who participated in sport and physical activities in the past year, 18.9% of those participated in sport and physical activities three or more days per week while 22.8% participated one or two days per week. The percentage of those with disabilities in this age group who participated in sport and physical activities at least one day per week came to 41.7%, compared to 26.9% who responded that they did not participate at all. Regarding the types of sport and physical activities conducted in the past year, “Walking” was the most popular at 36.6%, followed by “Strolling” (31.9%) and “Jump rope” (30.5%). “Walking,” “Strolling,” “Jump rope” and “Calisthenics and light exercises” had high participation rates for all disability types.
2. Current Status and Issues of Inclusive Physical Education
Current Status and Issues of Children and Young People with Disabilities in School Physical Education
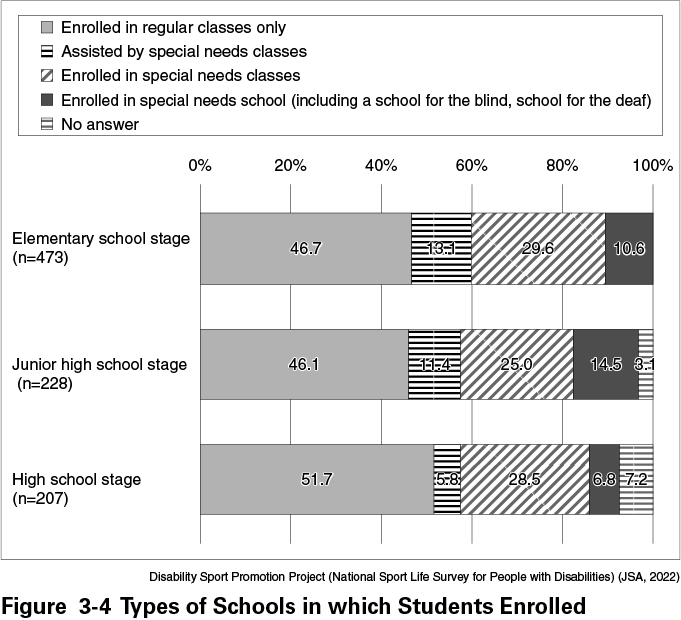
The above survey also asked students about the types of schools and the status of school physical education, and the school types were categorized into “Enrolled in regular classes only”, “Assisted by special needs classes”, “Enrolled in special needs classes” and “Enrolled in a special needs school (including a school for the blind, a school for the deaf)” by educational stage of elementary, junior high and high schools. Results by school types show that between 40 and 50% of respondents were “Enrolled in regular classes only” for all educational stages (Figure 3-4). Regarding participation in school physical education, the highest percentage of students “participated almost every time” for any educational stages.
Reasons for Not Participating in Physical Education
The common reasons given by students who answered that they “did not participate at all”, “could not participate most of the time” and “participated for about half of the time” in school physical education were: “Because the type of activity was difficult for me to participate in”, “Because I thought I would cause trouble to other students” and “Because my supervising teacher did not ask me to participate” rather than medical reasons of “Because my doctor advised me not to”. These results reflected the lack of acknowledgement for the concept of adapted sports of considering having children and young people participate in physical education even when challenged with disabilities in the field. These findings suggest that not only physical education teachers at special needs schools but also those at elementary, junior high and high schools need basic knowledge and practical skills in physical education instruction for those with disabilities.